The Hidden Economics of Token-Based LLM Pricing: Why Your AI Costs Are Unpredictable
Token-based pricing creates inherently unpredictable costs that can vary by 300-400% between typical and peak usage scenarios.
What We Discovered
The rapid adoption of large language models has introduced a fundamental challenge that organizations are only beginning to understand: token-based pricing creates inherently unpredictable costs that can vary by 300-400% between typical and peak usage scenarios.
New research and real-world usage data reveal that current pricing mechanisms are less about computational cost recovery and more about risk allocation between providers and users.
Key findings:
- Daily token usage exhibits 8x variance between median and peak consumption
- Heavy-tailed distributions mean 95th percentile costs exceed median by 3-4x factors
- Weekend usage paradoxically peaks, defying business computing patterns
- Current pricing transfers 100% of variance risk to users while providers maintain stable margins
The Variance Problem in Practice
Consider the actual usage patterns from a typical organization's Claude deployment over 551 days. The data reveals striking patterns that challenge conventional assumptions about AI consumption.
Real Usage Data: 6.17 million tokens across 1,430 conversations, incurring $405.10 in total costs. While these aggregate numbers appear manageable, the underlying distribution tells a different story.
Extreme Daily Variance
Daily token usage exhibited extreme variance, with peak days consuming over 160,000 tokens while median days used fewer than 20,000 tokens. This eight-fold difference between typical and peak usage creates substantial budgeting challenges.
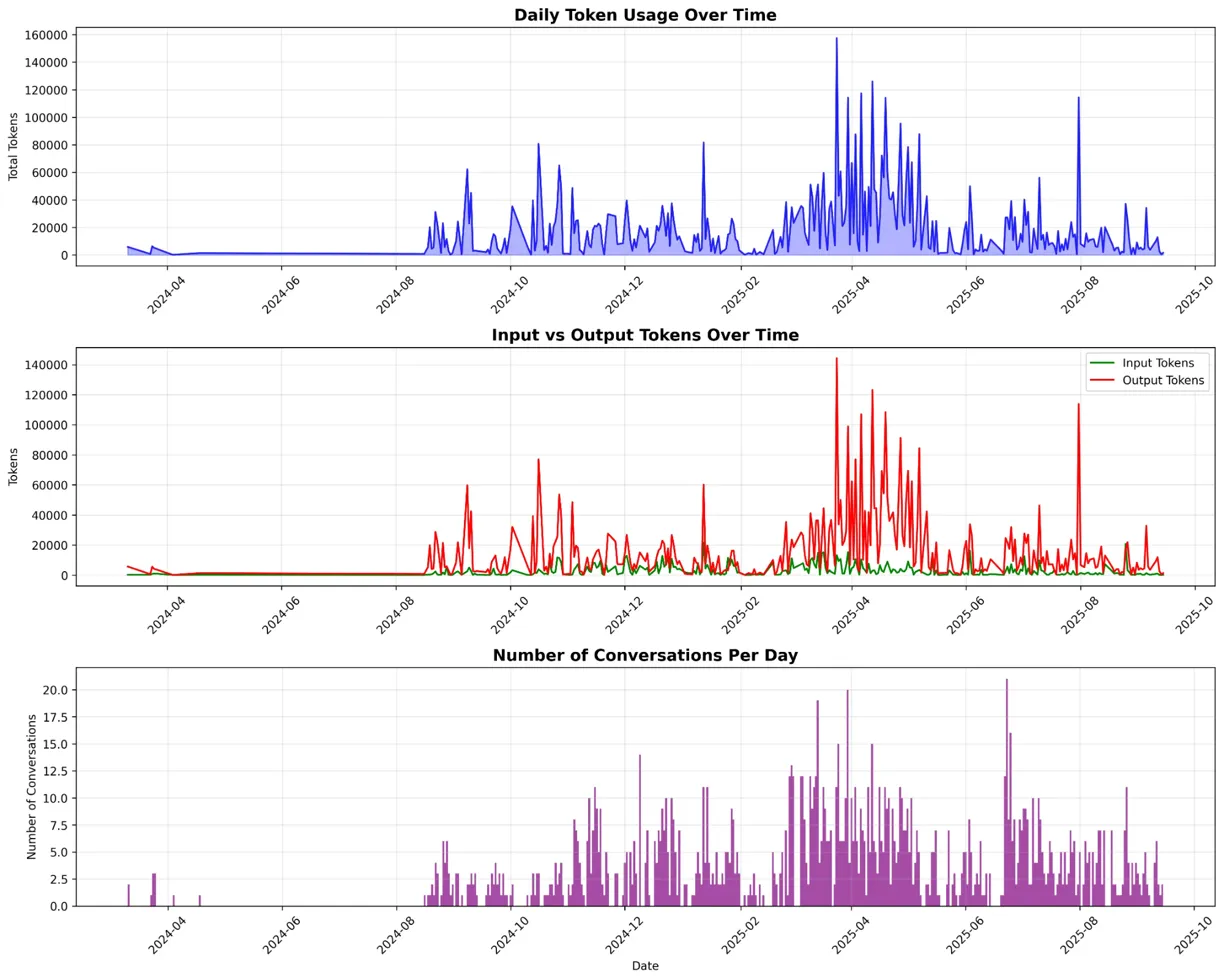 Daily Token Usage Over Time - Shows extreme variance with peaks reaching 8x median consumption
FIGURE 1: Daily Token Usage Over Time - Shows extreme variance with peaks reaching 8x median consumption
Unexpected Temporal Patterns
The temporal patterns prove equally problematic. Usage concentrates heavily during specific hours and days, with Sundays paradoxically showing the highest consumption at 1.12 million tokens—nearly 16% above Monday's usage.
This weekend spike defies traditional business computing patterns and suggests that LLM usage follows fundamentally different dynamics than conventional enterprise software.
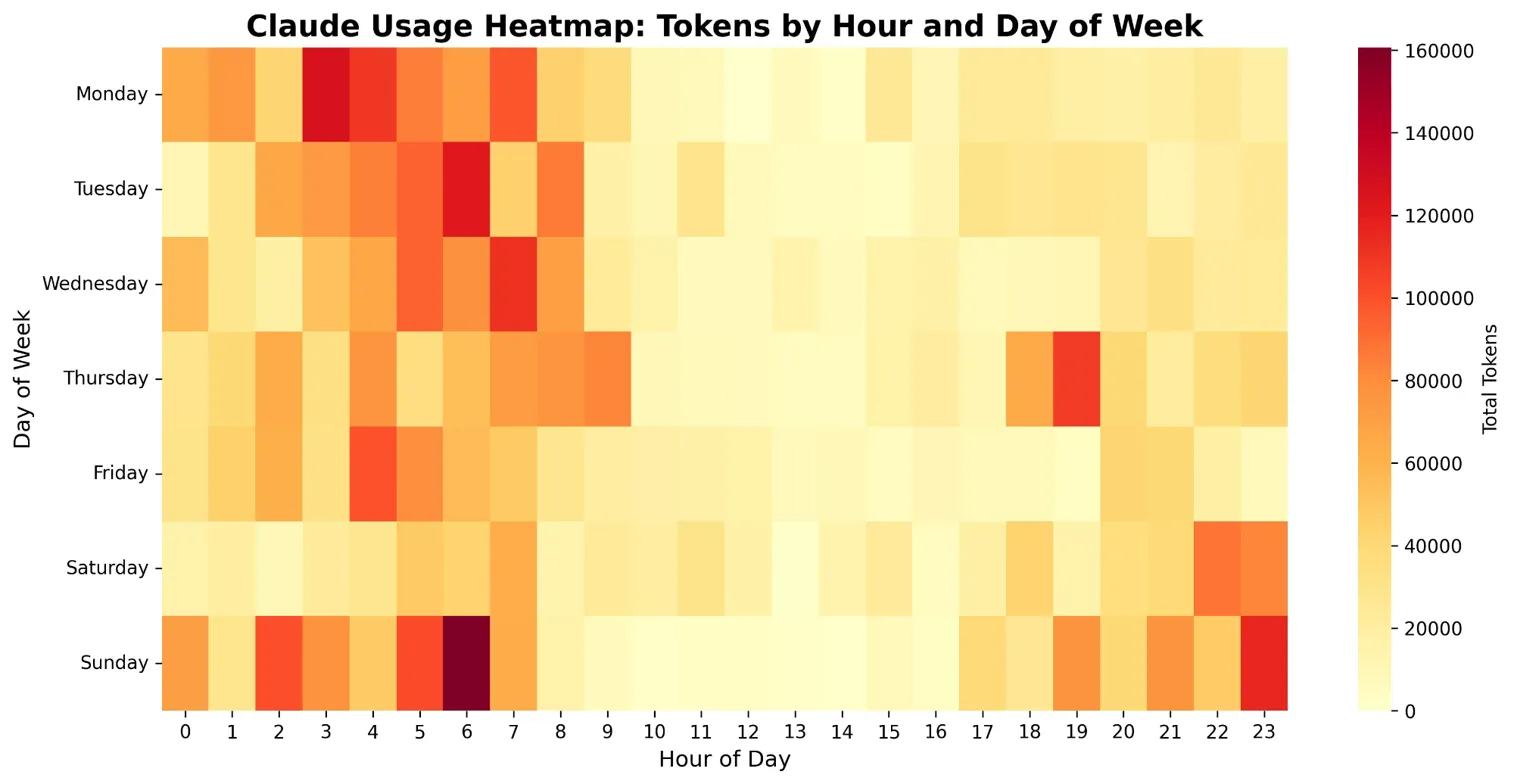 Claude Usage Heatmap showing concentrated consumption during specific time blocks with unexpected weekend peaks
FIGURE 2: Temporal Consumption Patterns - Reveals concentrated consumption during specific time blocks with unexpected weekend peaks
Heavy-Tailed Distributions and Bill Shock
Recent academic research from Briefcase AI provides the theoretical framework for understanding these patterns. Token consumption follows heavy-tailed lognormal distributions where the 95th percentile costs exceed the median by factors of 3-4x.
The Cost Distribution Reality
This means that while an organization might budget based on average usage of $0.74 per conversation, they regularly encounter conversations costing $3-4, with outliers reaching $10 or more.
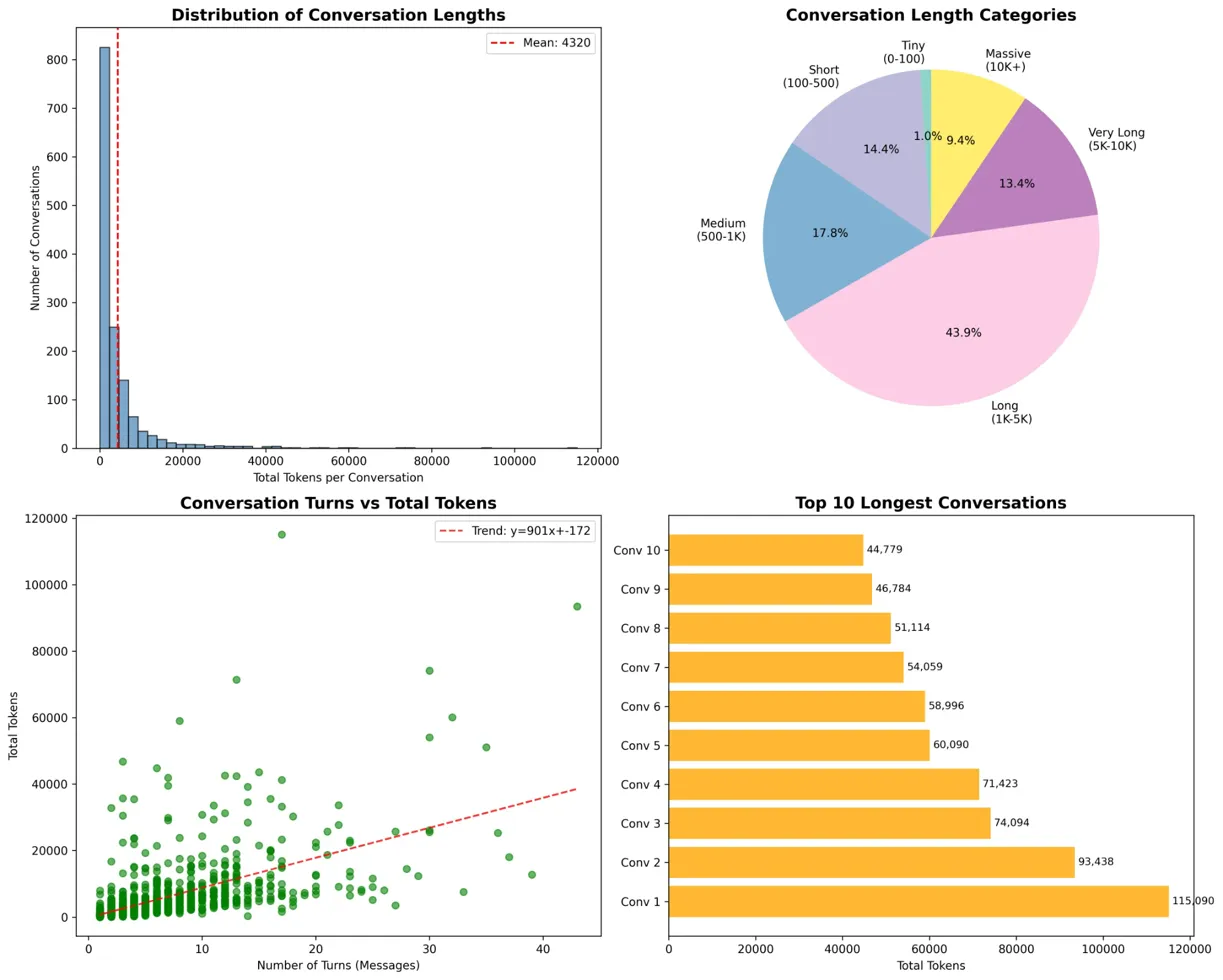 Conversation Length Distribution showing heavy-tailed distribution with mean at 4,320 tokens but extreme outliers exceeding 100,000 tokens
FIGURE 3: Conversation Length Distribution - Heavy-tailed distribution with mean at 4,320 tokens but extreme outliers exceeding 100,000 tokens
Conversation Length Breakdown
The distribution analysis reveals:
- 43.9% of conversations fall into the "long" category (1,000-5,000 tokens)
- 13.4% qualify as "very long" (5,000-10,000 tokens)
- 9.4% reach "massive" proportions exceeding 10,000 tokens
These tail events, while comprising less than 25% of conversations, can account for over 50% of total costs.
Mathematical Properties
The mathematical properties of these distributions create what researchers term "bill shock"—the phenomenon where users cannot predict their costs even with extensive historical data. The coefficient of variation often exceeds 1.0, meaning the standard deviation exceeds the mean cost, a statistical indicator of extreme unpredictability.
Risk Allocation: The Core Economic Challenge
Current token-based billing mechanisms transfer 100% of variance risk to users while providers maintain predictable revenue per compute unit. This risk allocation creates misaligned incentives: users adopt defensive strategies like aggressive prompt compression and strict output limits, potentially sacrificing output quality to manage cost uncertainty.
Six Pricing Mechanism Types
The research identifies six distinct pricing mechanisms and their risk allocation profiles:
1. Per-token billing places all variance risk on users, creating high friction but allowing providers to maintain stable margins.
2. Bundle pricing inverts this relationship, with providers absorbing variance risk in exchange for predictable user costs.
3. Hybrid models combining seat licenses with usage-based components distribute risk more evenly, achieving 60-80% variance reduction while maintaining provider flexibility.
Market Evidence
The market evidence supports theoretical predictions. Major providers have introduced cached pricing with 50-90% discounts for repeated queries—a primitive form of congestion management. Enterprise agreements increasingly feature negotiated bundles and caps, reflecting sophisticated buyers' demands for cost predictability.
Strategic Behavior and Market Evolution
The game-theoretic analysis reveals that current pricing creates a prisoner's dilemma. Users engage in excessive prompt optimization that reduces system efficiency, while providers compete primarily on per-token rates rather than mechanism innovation.
User Adaptation Patterns
Real usage data confirms these strategic behaviors. Analysis of conversation patterns shows clear evidence of prompt engineering, with input tokens carefully managed while output tokens vary more widely.
The input-to-output ratio of approximately 1:5.4 suggests users minimize prompts while accepting variable response lengths, a rational response to differential pricing where output tokens typically cost twice as much as input tokens.
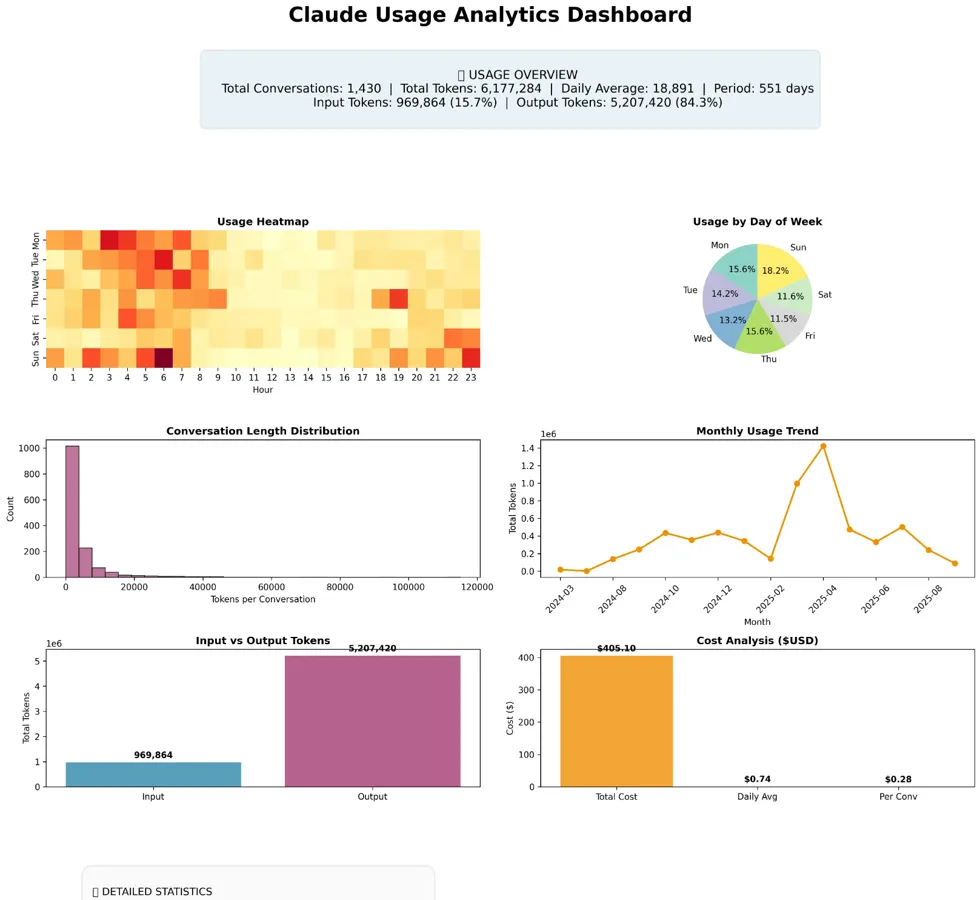 Analytics Dashboard showing $405.10 total cost across 1,430 conversations with 1:5.4 input-output ratio
FIGURE 4: Analytics Dashboard - Shows $405.10 total cost across 1,430 conversations with 1:5.4 input-output ratio
Nash Equilibrium
The Nash equilibrium under perfect competition involves providers offering risk-sharing mechanisms with prices approaching marginal cost plus a risk premium.
The Path Forward: Alternative Pricing Mechanisms
The research proposes several alternative mechanisms that better align incentives:
1. Insurance-Style Models
Insurance-style models combining base fees with catastrophic coverage cap downside risk while maintaining usage incentives. Organizations pay a predictable monthly fee covering typical usage, with additional charges only for extreme outliers.
Benefits: Reduces variance by 75% while preserving 90% of the efficiency incentives.
2. Outcome-Based Pricing
Outcome-based pricing charges per task completed rather than tokens consumed. While measurement challenges exist, this approach aligns provider and user incentives toward efficiency.
Early results: Customer service applications show 40% cost reduction with improved satisfaction metrics.
3. Dynamic Congestion Pricing
Dynamic congestion pricing adjusts rates based on system load, similar to surge pricing in transportation. By charging premium rates during peak periods and discounts during off-peak times, providers can smooth demand while offering users cost-saving opportunities.
The Sunday usage spike in the data, for instance, could be managed through time-of-use pricing.
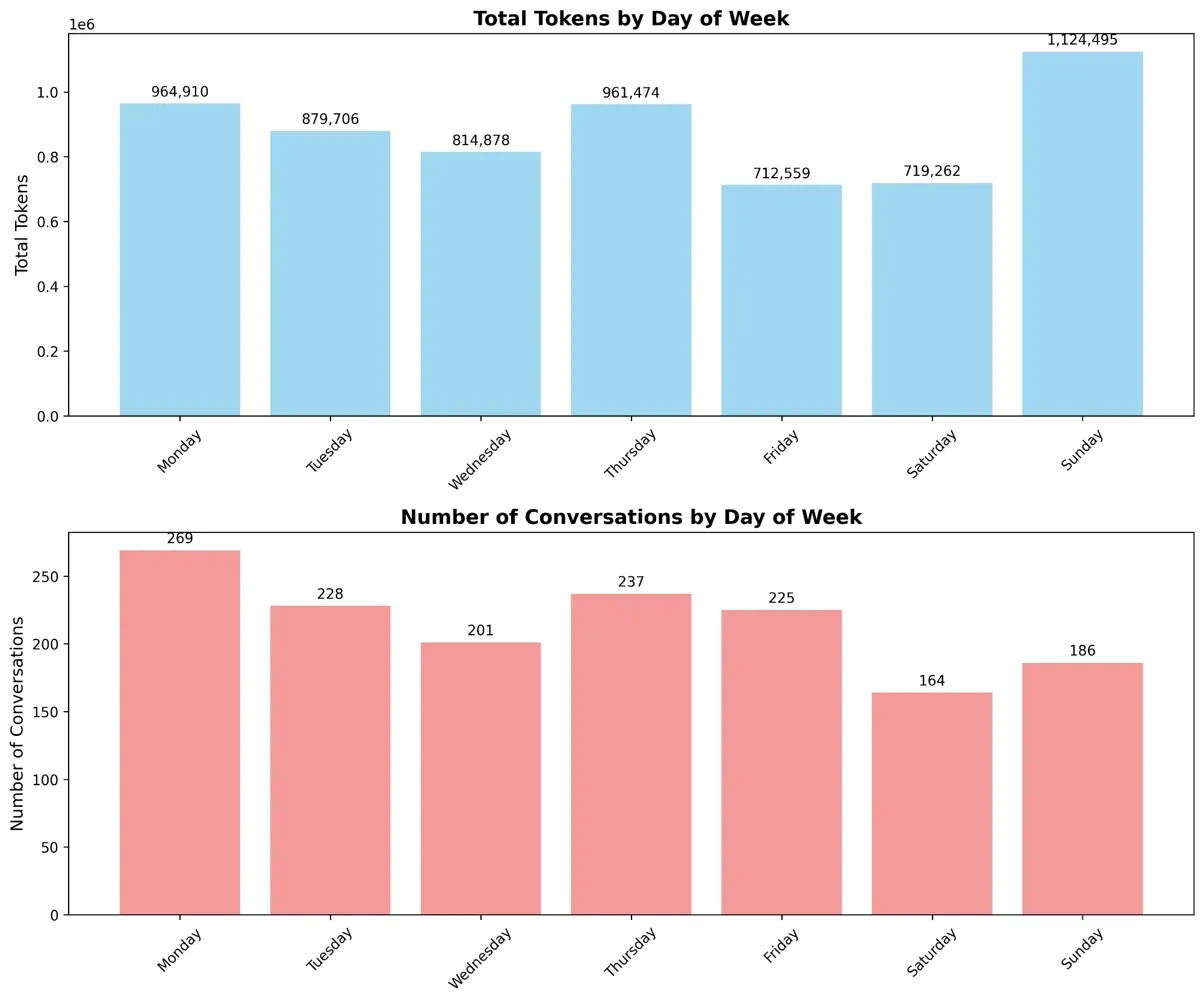 Day-of-Week Patterns showing Sunday peak at 1.12M tokens versus weekday average
FIGURE 5: Day-of-Week Patterns - Sunday peak at 1.12M tokens versus weekday average of 900K tokens
Market Implications and Recommendations
The LLM market faces 80-90% annual price compression, making mechanism design crucial for differentiation beyond pure price competition. Organizations should consider three strategic imperatives:
1. Negotiate Risk-Sharing Provisions
Negotiate enterprise agreements with risk-sharing provisions. The variance in token consumption makes per-token billing unsuitable for production deployments. Hybrid models combining predictable base costs with capped overages provide budget certainty while maintaining flexibility.
2. Implement Sophisticated Monitoring
Implement sophisticated monitoring and optimization systems. Understanding usage patterns at the conversation level enables targeted optimization. The data shows that the longest 10% of conversations consume disproportionate resources—identifying and optimizing these outliers yields substantial savings.
3. Prepare for Outcome-Based Evolution
Prepare for the evolution toward outcome-based pricing. As measurement capabilities improve and competition intensifies, the market will shift from charging for compute units to charging for business value. Organizations that develop robust outcome measurement frameworks now will be positioned to capitalize on this transition.
Conclusion: Beyond Token Economics
Token-based pricing for large language models represents a temporary phase in the technology's commercialization. The inherent unpredictability of token consumption, combined with heavy-tailed usage distributions and strategic user responses, makes current mechanisms economically inefficient.
The Winning Strategy
The winners in the emerging AI economy will be those who recognize that pricing mechanisms shape behavior, distribute risk, and determine market evolution. Providers who innovate beyond per-token billing—through hybrids, bundles, and eventually outcome-based pricing—will capture greater value while reducing user friction.
The Message for Organizations
For organizations deploying LLMs at scale, the message is clear: treat pricing negotiations as risk management exercises, not simple rate discussions. The 3-4x variance between typical and peak costs means that mechanism design matters more than marginal per-token rates.
As the market matures, competitive advantage will shift from model quality to economic innovation—those who master the hidden economics of token-based pricing will thrive in the AI-transformed economy.
Technical Implementation
The analysis in this article was conducted using our open-source LLM Token Analytics Library, which provides comprehensive tools for analyzing token consumption patterns and cost optimization.
📊 View the GitHub Repository →
🛠️ Technical Implementation Guide → - Complete Python walkthrough
For developers and data engineers looking to implement similar analysis in their organizations, the library provides production-ready tools for token tracking, cost analysis, and pricing mechanism evaluation.
Based on analysis of production LLM usage data and research from Briefcase AI
Want fewer escalations? See a live trace.
See Briefcase on your stack
Reduce escalations: Catch issues before they hit production with comprehensive observability
Auditability & replay: Complete trace capture for debugging and compliance