Managed Inference Cost Analysis: Where API Pricing Stops Working for Agent Workloads
A single infrastructure strategy does not hold across workload types. At standard API volume, per-token pricing is the cost leader. At agent scale, fixed-cost infrastructure takes over.
What We Analyzed
This analysis evaluates 11 provider/model combinations using published list prices as of February 21, 2026 across two operating regimes:
- Standard API workload: 100M tokens/month
- Agent workload: 1.6B tokens/month
Every provider is scored with one canonical cost model:
monthly_cost = (input_tokens/1M × input_rate) + (output_tokens/1M × output_rate) + fixed_monthly + egress
We also apply overhead assumptions (retry, guardrails, caching) and quality/SLA filters before ranking providers.
Recommendation up front:
- For predictable API workloads under ~1B tokens/month, stay with pay-per-token providers.
- For sustained agent workloads around or above ~1B tokens/month, evaluate fixed-cost infrastructure immediately.
Key Findings at 100M Tokens/Month
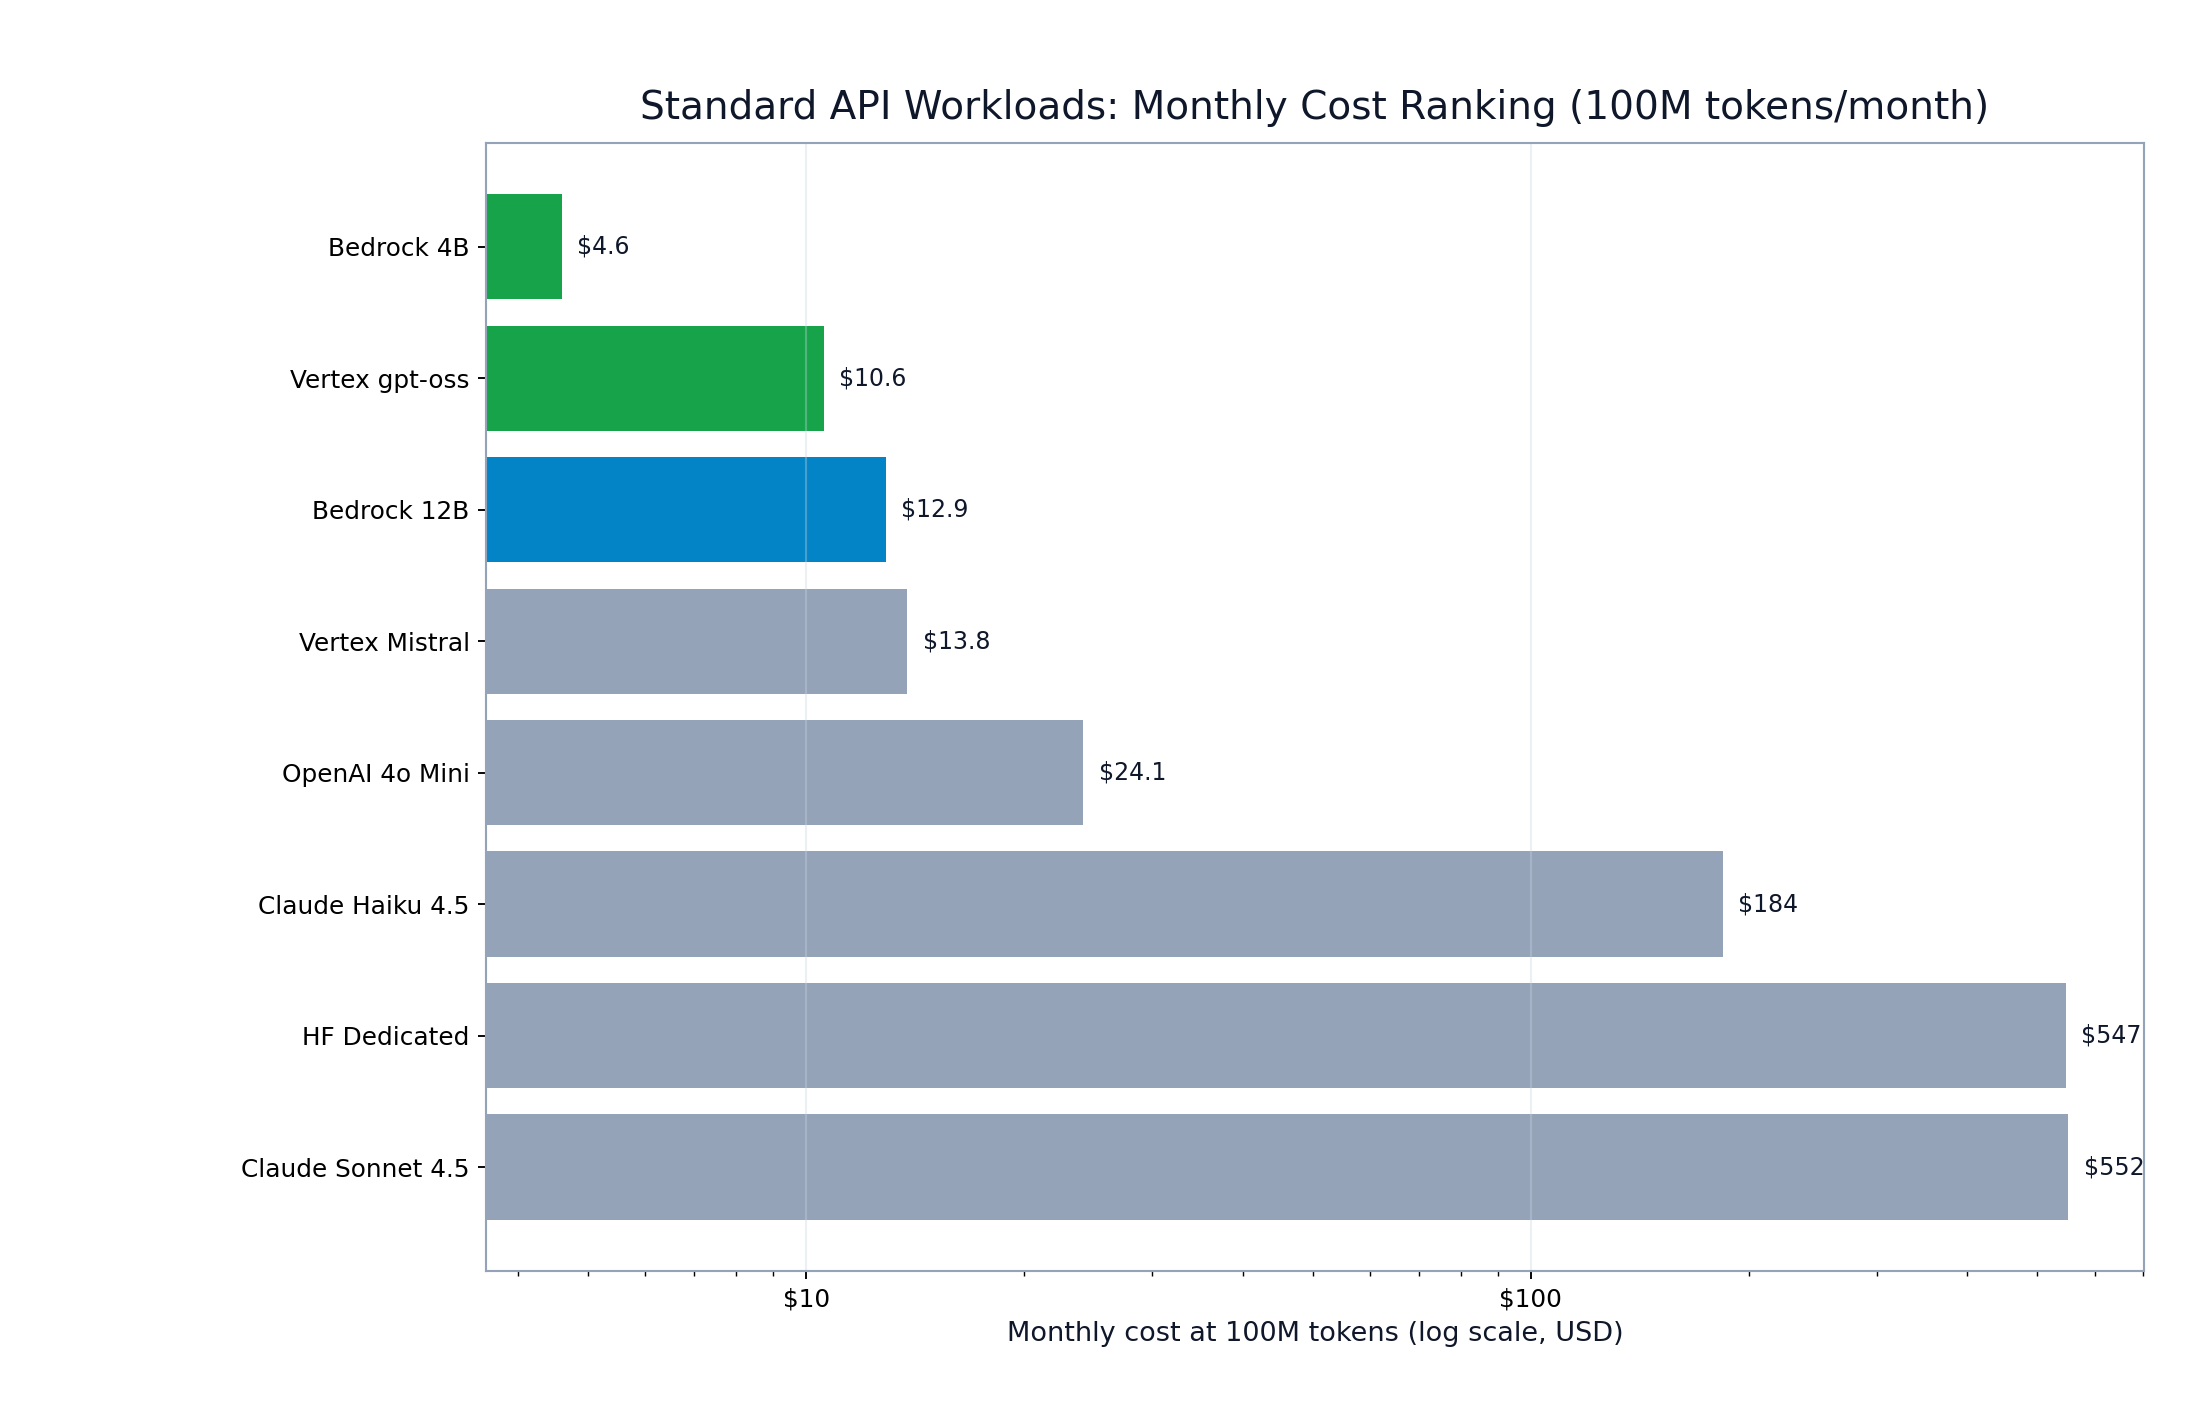
At standard API volume, pay-per-token providers dominate on cost. The cheapest tier-4 options stay in the low double-digits per month.
Standard API ranking (directional)
| Rank | Provider | Monthly Cost (100M) |
|---|---|---|
| #1 | Bedrock Gemma 3 4B | ~$4.6 |
| #2 | Vertex gpt-oss | ~$10.6 |
| #3 | Bedrock 12B | ~$12.9 |
| #4 | Vertex Mistral | ~$13.8 |
The practical default for quality/cost balance is Bedrock 12B (~$12.9/mo) when tier-4 quality is required.
 Standard API monthly ranking at 100M tokens
FIGURE 1: Standard API ranking at 100M tokens/month (log-scale x-axis to show spread across providers).
Why Agent Workloads Flip the Ranking
Agent assumptions materially change the economics:
- Input/output mix shifts to 35/65 (output-heavy)
- Net overhead increases to ~1.20x
- Minimum quality threshold increases to tier >= 4
Under that profile, costs that looked negligible in API mode scale sharply for per-token pricing, while fixed-cost options remain flat.
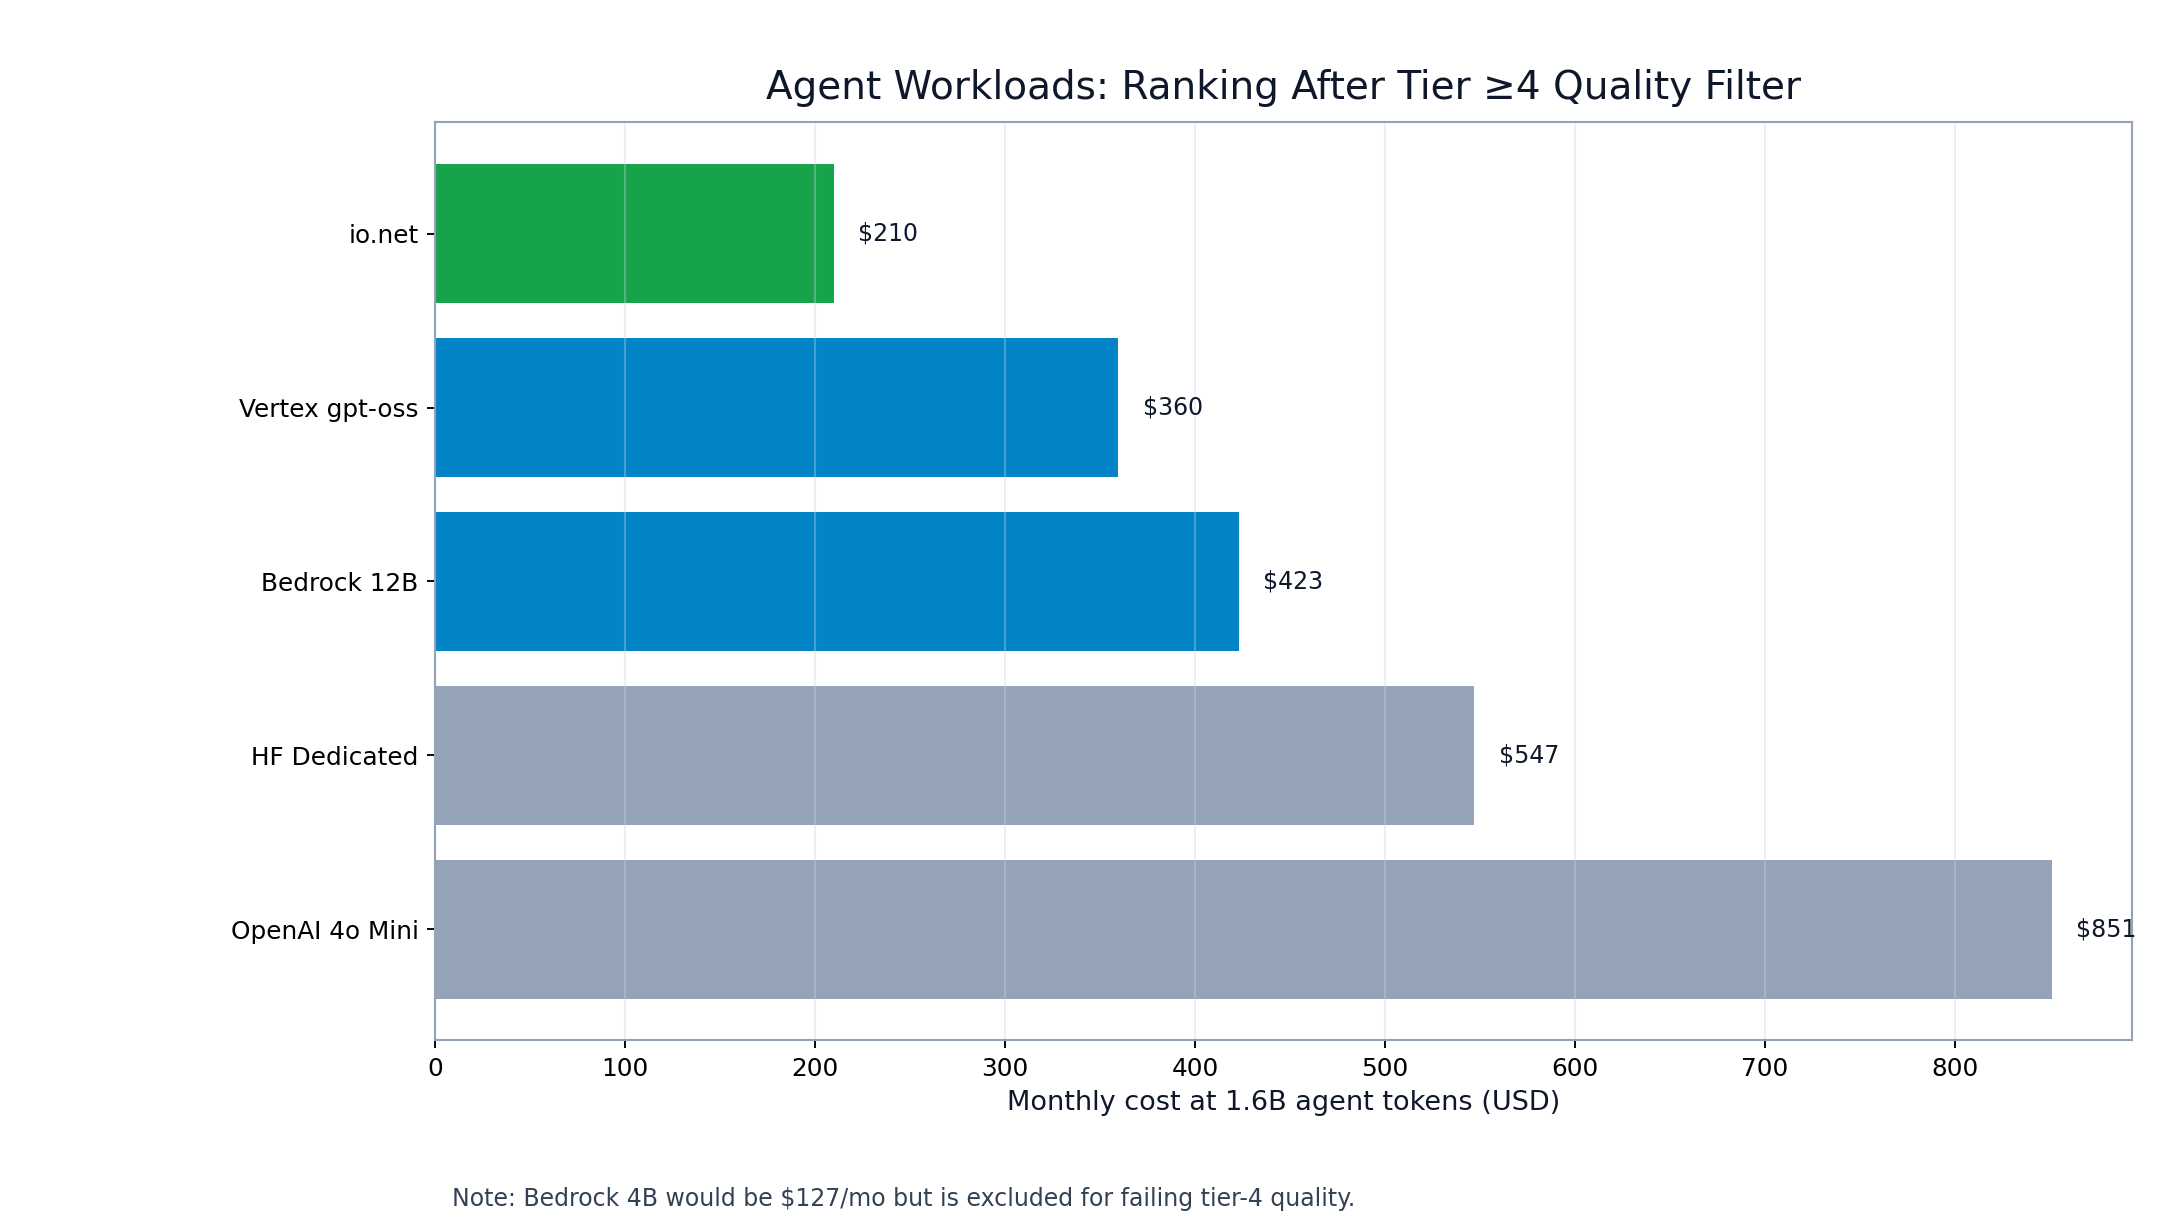
Agent ranking at 1.6B tokens/month (tier >= 4)
| Rank | Provider | Monthly Cost (Agent) |
|---|---|---|
| #1 | io.net | ~$210 |
| #2 | Vertex gpt-oss | ~$360 |
| #3 | Bedrock 12B | ~$423 |
| #4 | HF Dedicated | ~$547 |
| #5 | OpenAI 4o Mini | ~$851 |
 Agent workload monthly ranking at 1.6B tokens
FIGURE 2: Agent ranking after applying tier >= 4 quality filter. io.net leads at 1.6B tokens/month.
The magnitude of change is the operational shock. Per-token providers rise by roughly 28x to 38x from standard mode to agent mode.
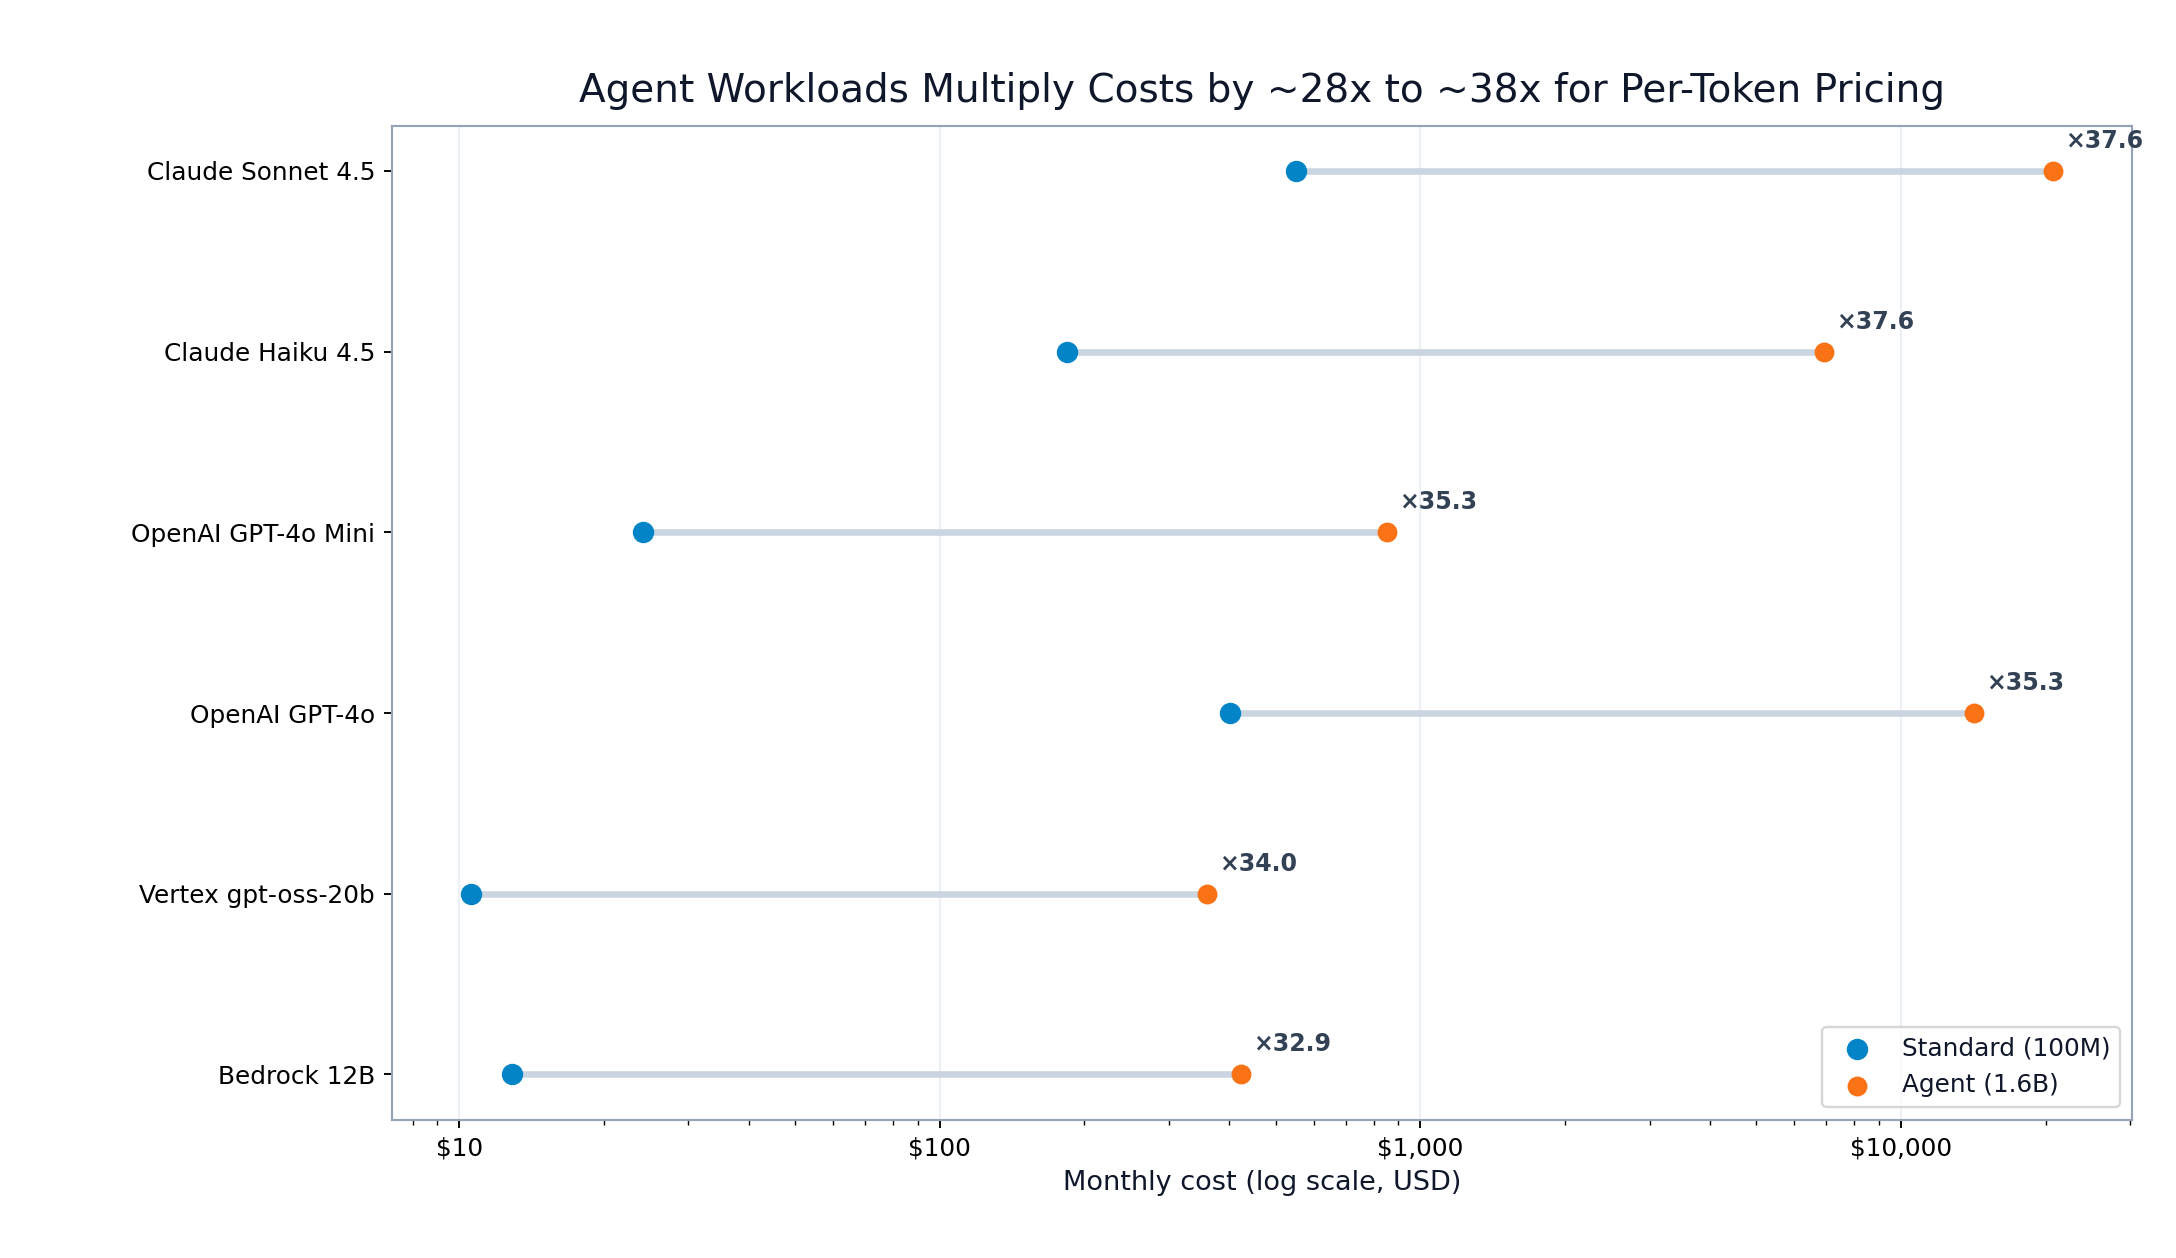 Agent-to-standard monthly cost multipliers by provider
FIGURE 3: Agent workloads multiply per-token costs by ~28x to ~38x across major providers.
The 6-Month Budget Reality
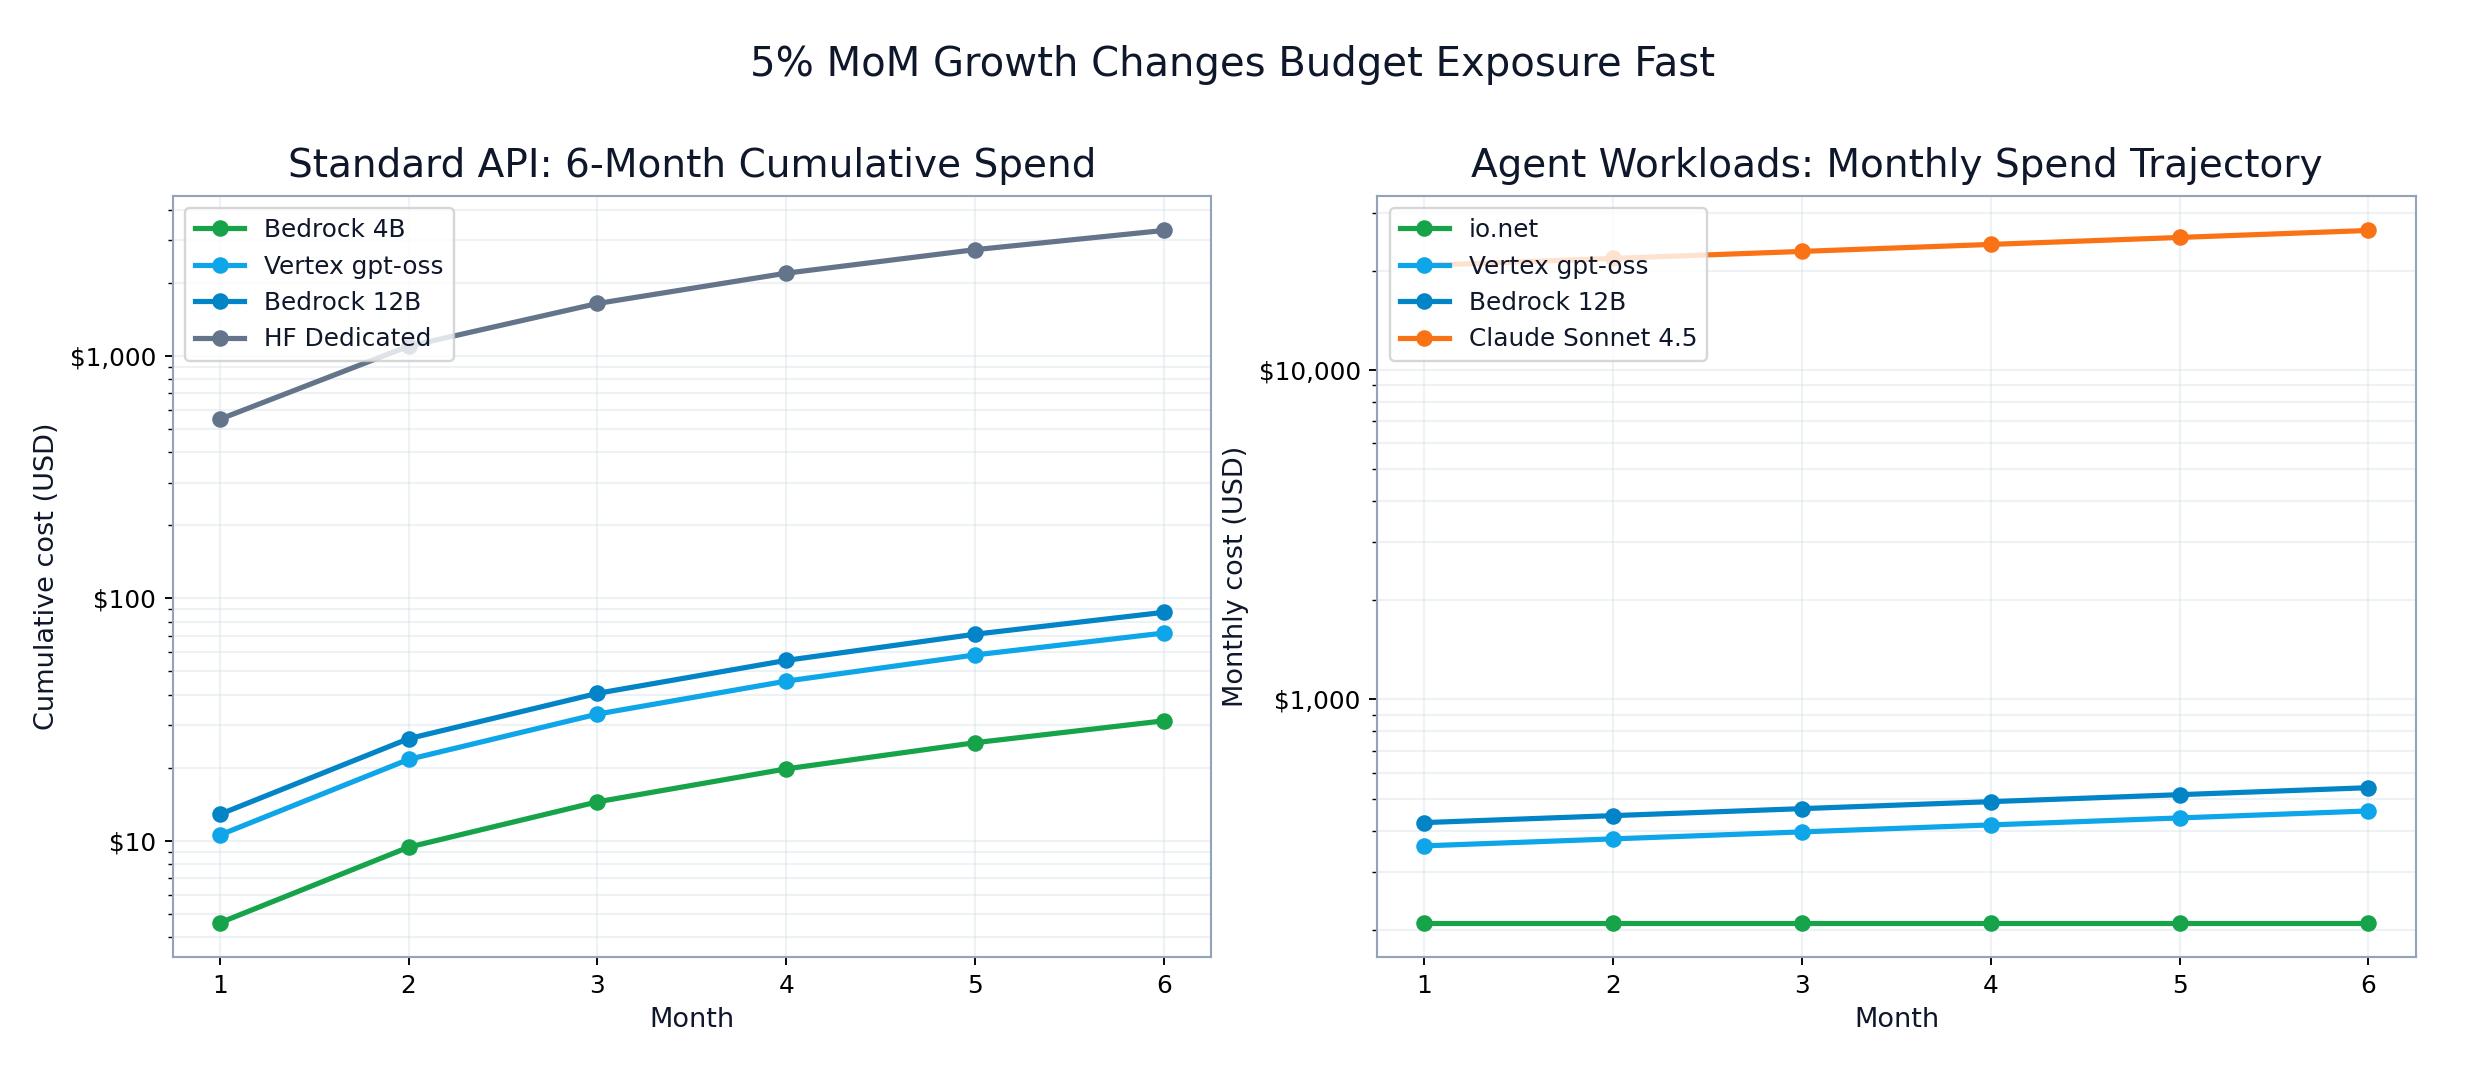
With 5% month-over-month volume growth, short-term budget exposure diverges quickly:
- io.net: ~$1.26K over 6 months (flat monthly profile)
- Vertex gpt-oss: ~$2.45K over 6 months
- Bedrock 12B: ~$2.88K over 6 months
- Claude Sonnet 4.5: ~$141K over 6 months
This is why agent infrastructure choices are not just optimization decisions; they are budget-shaping decisions.
 Six-month standard and agent cost forecast
FIGURE 4: Two-panel 6-month view: standard cumulative spend (left) and agent monthly trajectory (right).
Break-Even Thresholds That Change Decisions
The key thresholds are explicit:
- io.net vs Bedrock 12B: break-even at ~1.63B tokens/month
- HF Dedicated vs Bedrock 12B: break-even at ~4.25B tokens/month
Interpretation:
- Below ~1B agent tokens/month, pay-per-token can still win.
- Around and above ~1B to ~1.6B sustained tokens/month, fixed-cost options become structurally advantaged.
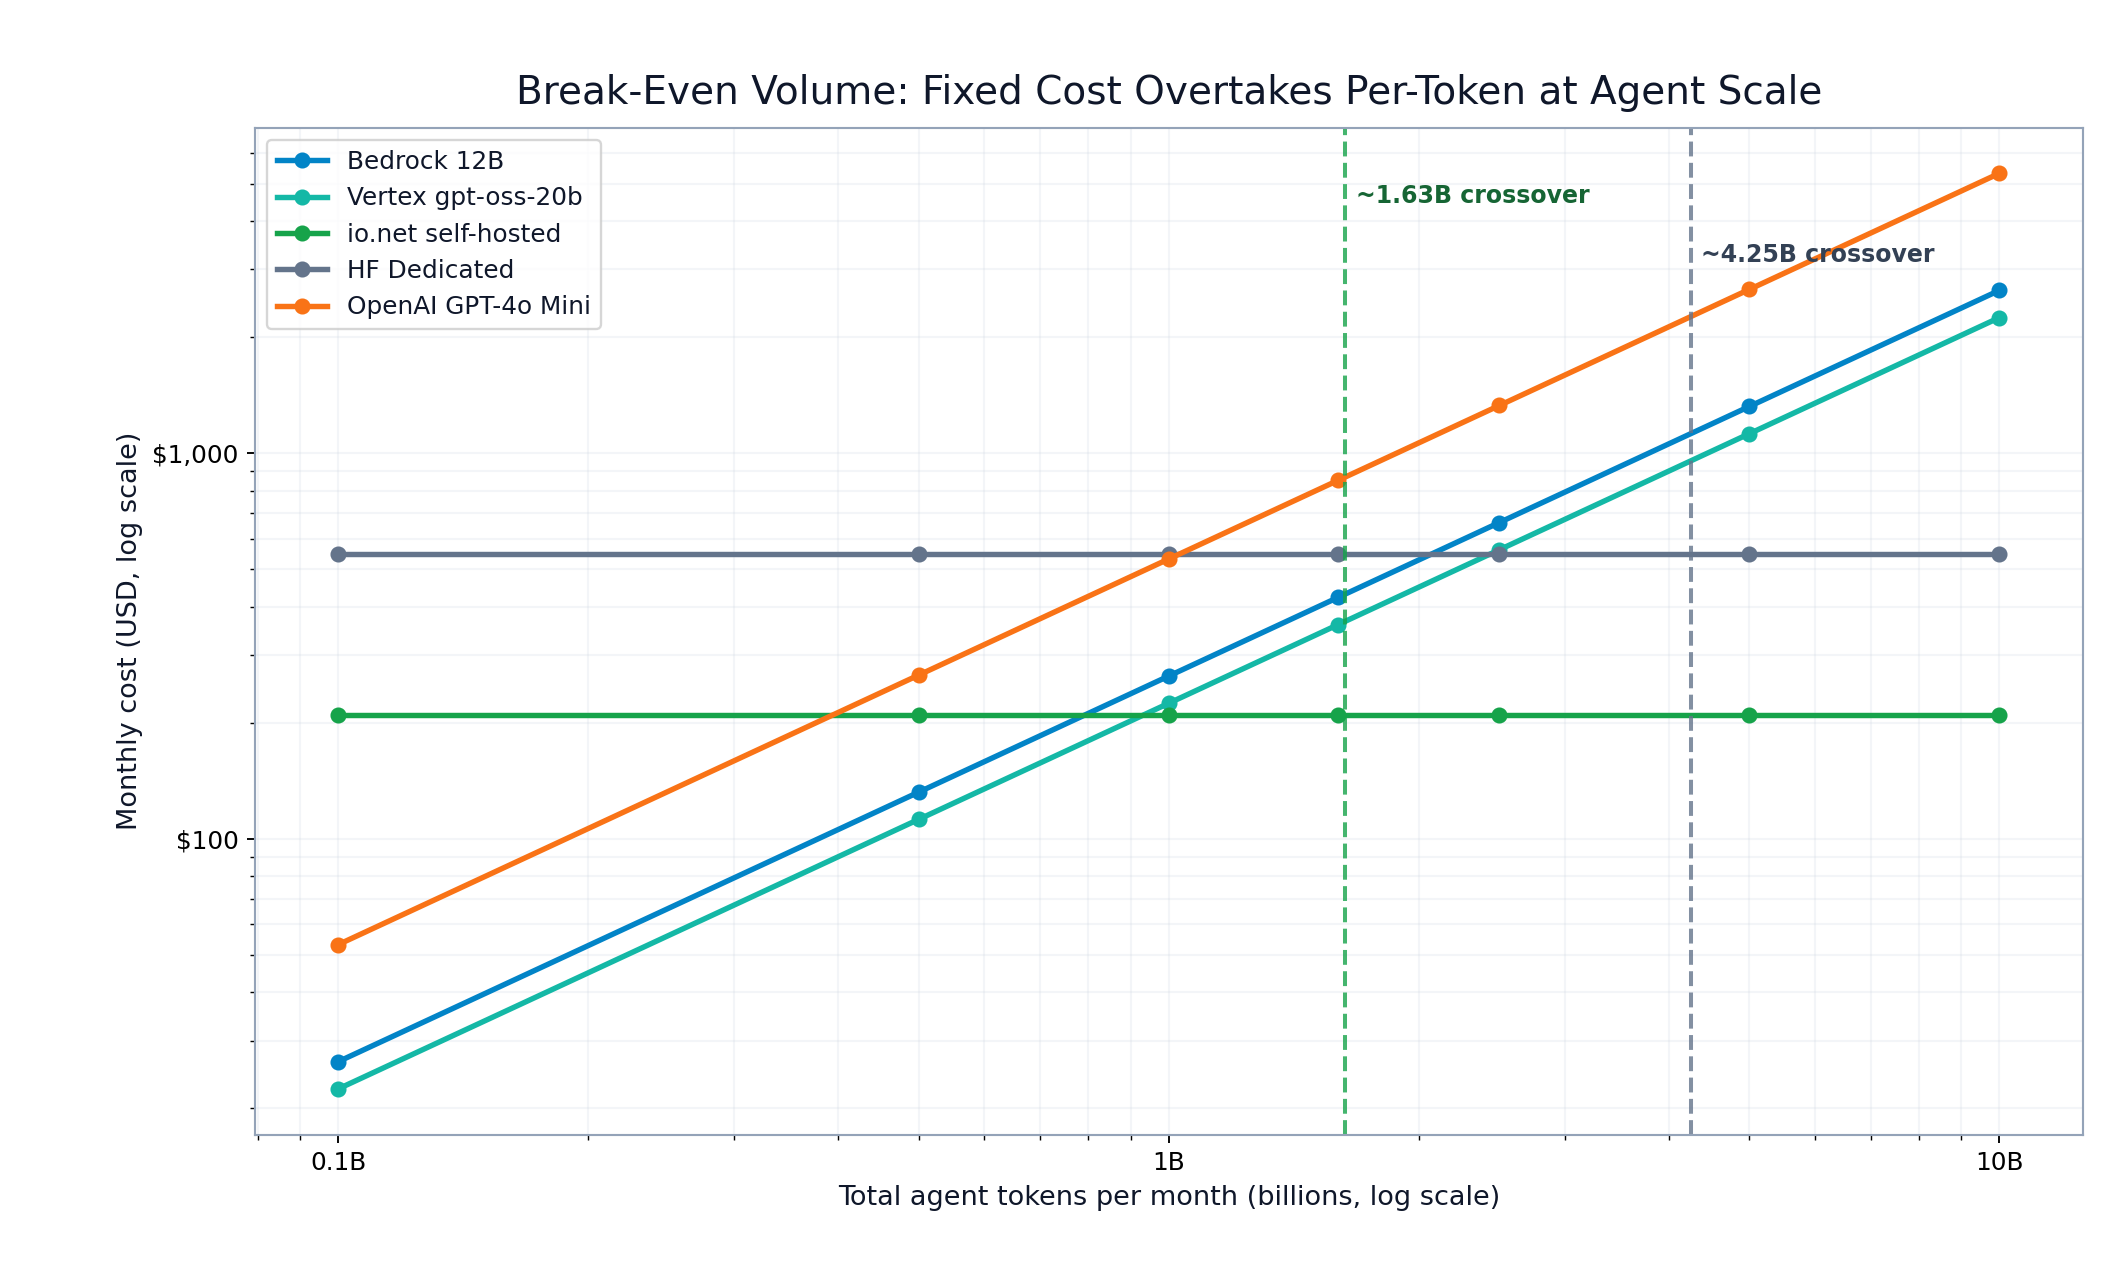 Break-even and crossover by monthly agent token volume
FIGURE 5: Volume crossover map (log-scale). Exact modeled break-even points: 1,631,720,649 and 4,250,243,787 tokens/month.
Sensitivity: What Matters Most
Two things can be true simultaneously:
- I/O ratio matters: output-heavy workloads materially increase per-token spend.
- Volume and pricing model matter more: fixed-cost options stay flat while per-token lines keep climbing.
In standard API mode, rankings remain stable across tested I/O mixes. In agent mode, I/O changes move costs, but they do not erase the fixed-cost advantage at sustained high volume.
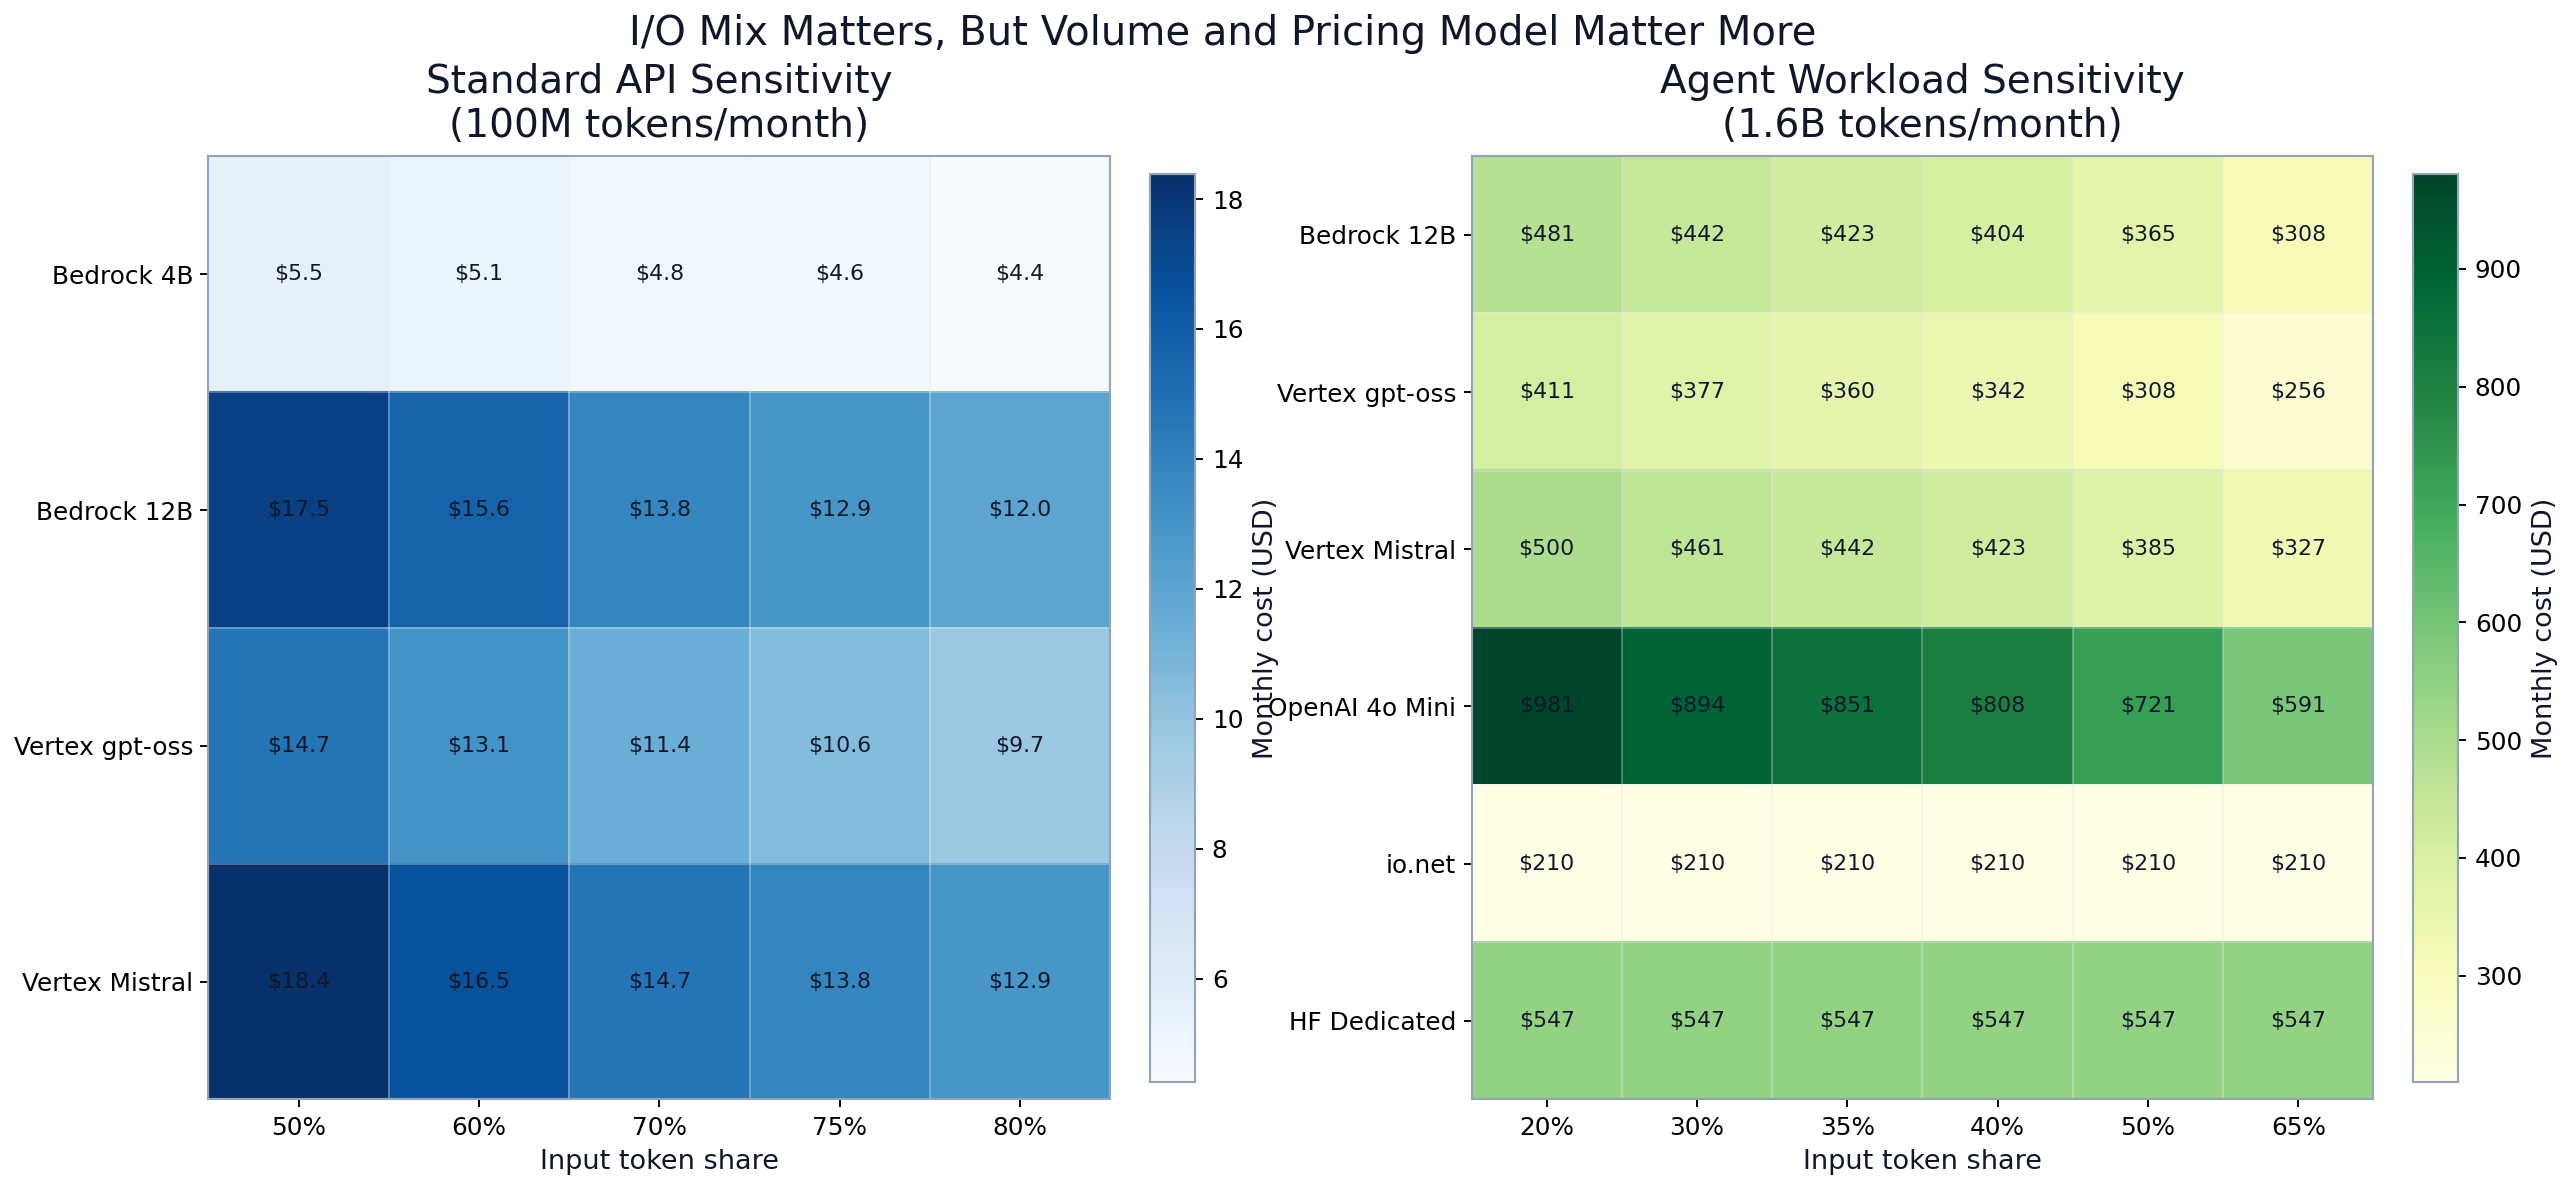 Sensitivity heatmaps for standard and agent I/O ratio shifts
FIGURE 6: Sensitivity heatmaps. Standard API remains low-cost under tested ratios; agent mode remains structurally cost-heavy for per-token pricing.
Decision Framework
Use this as an operating policy:
- If you are in standard API mode and below sustained billion-token volume, optimize within pay-per-token.
- If you are in agent mode and approaching sustained billion-token volume, run fixed-cost infra evaluation now.
- Enforce tier >= 4 quality for production agents before final cost comparisons.
Assumptions and Limitations
- Pricing uses published list prices as of February 21, 2026; enterprise discounts are excluded.
- Quality tier scores are estimated by model class and should be validated against your own eval suite.
- SLA/latency values for some providers are estimated and may differ by region and contract terms.
- io.net pricing is marketplace-dynamic; modeled fixed cost is a reference estimate, not a guaranteed quote.
- Agent assumptions (tasks, calls/task, tokens/call, overhead) are illustrative and should be replaced with your production telemetry.
- Model excludes some second-order costs (for example, advanced networking or multi-region replication add-ons).
Related Reading
- How We Built the Inference Cost Forecasting Model: Technical Methodology
- The Hidden Economics of Token-Based LLM Pricing: Why Your AI Costs Are Unpredictable
- Building Production Token Analytics: Technical Implementation Guide
- AI Observability Tools: Which One Actually Fits Your Problem?
Methodology baseline: published list-price snapshot dated February 21, 2026.
Want fewer escalations? See a live trace.
See Briefcase on your stack
Reduce escalations: Catch issues before they hit production with comprehensive observability
Auditability & replay: Complete trace capture for debugging and compliance